

Virginia Mason Health System


Lorem ipsum dolor sit amet, consectetur adipiscing elit. Ut a volutpat nulla. Proin a cursus odio. Duis hendrerit ipsum vitae ante feugiat placerat. Maecenas in velit tempus metus efficitur scelerisque in vitae nisi. Vestibulum odio mauris, ultricies ut nisl sed, tincidunt viverra tellus. Phasellus sed neque nunc.
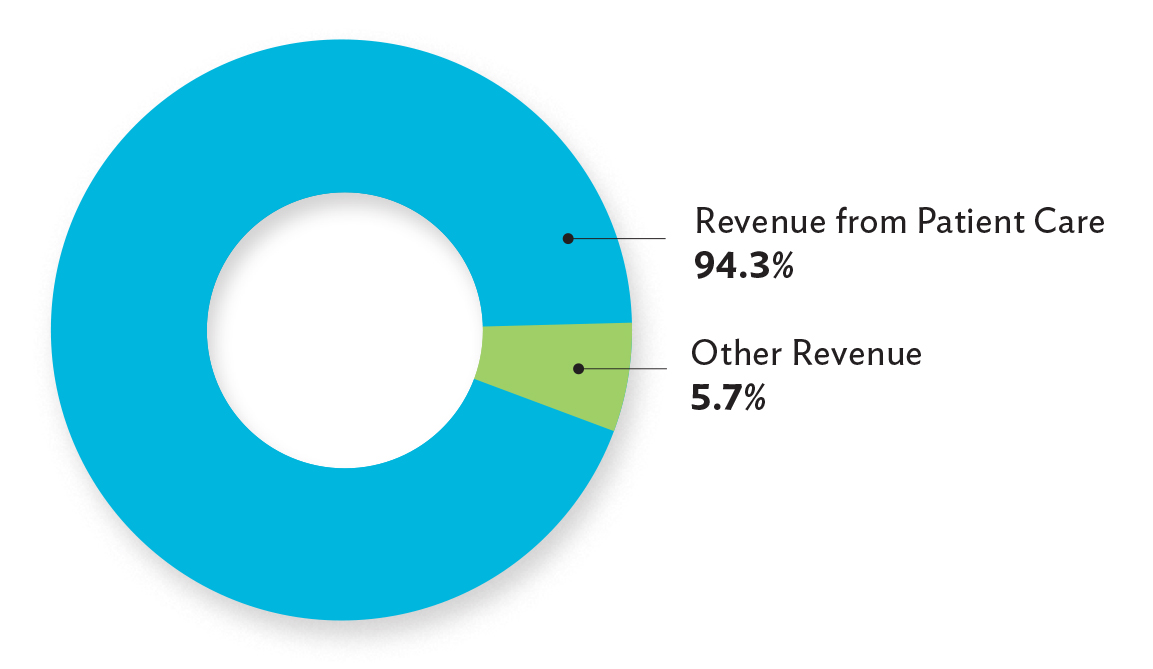
| 2018 | 2017 | |
|---|---|---|
| Net Revenue from Patient Care This amount represents the revenue Virginia Mason received from patient care services. | $957,505 | $911,128 |
| Other Operating Revenue This amount represents the revenue for any non patient care activities. | 67,637 | 65,683 |
| Total Revenue | $1,025,142 | $976,811 |
| Total Expenses This amount represents the cost of salaries and benefits, supplies, utilities, interest, taxes and other operating costs. | $1,017,819 | $978,995 |
| Operating Income (Loss) This amount represents the revenue that remains after operating costs are covered. | 7,323 | (2,184) |
| Percent Margin* | .7% | (.2%) |
| Nonoperating Income This amount represents the income or (loss) Virginia Mason received from investments and other sources. | 13,077 | 17,431 |
| Total Income | $20,400 | $15,247 |
| Percent Margin To stay viable, Virginia Mason must meet expenses and have money left over (margin) to invest in people, technology and facilities. | 2.0% | 1.6% |


